
The average BCP home fell £6,142 in a year to £310,094 in July. Flats dropped 4.1% to their lowest since 2021, while Dorset and the New Forest held level.
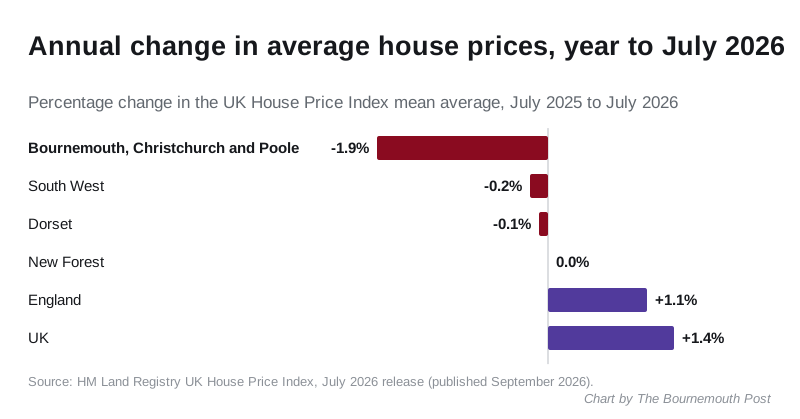
The average home in Bournemouth, Christchurch and Poole sold for £310,094 in July. That is £6,142 less than a year earlier, a fall of 1.9%.
The figures come from the latest HM Land Registry UK House Price Index, published this week. Prices also slipped 0.8% between June and July.
The fall is getting steeper, not easing. In the revised June figures, the annual drop was 1.4%. A month later it is 1.9%.
The neighbours have stopped rising, but BCP is still falling fastest
A month ago every area around us was still going up. In July they stalled, while BCP kept going down:
| Area | Average price, July 2026 | Change on a year |
|---|---|---|
| Bournemouth, Christchurch and Poole | £310,094 | -1.9% |
| South West | £302,298 | -0.2% |
| Dorset | £325,154 | -0.1% |
| New Forest | £384,977 | 0.0% |
| England | £293,479 | +1.1% |
| UK | £272,611 | +1.4% |
Sources: HM Land Registry UKHPI for Dorset, the New Forest, the South West and England.
The average BCP home is still worth more than the average across the South West, by £7,796. But the gap with Dorset, the council area to our west, has widened to £15,060.
Flats are at their lowest since January 2021
Every property type lost value over the year. Flats lost the most:
- Flats and maisonettes: £196,471, down 4.1%
- Detached: £551,316, down 0.9%
- Terraced: £292,369, down 0.6%
- Semi-detached: £356,748, down 0.1%
The average flat is now worth less than at any point since January 2021, when the index put it at £195,465. Its peak was £226,735 in December 2022, so the average flat has lost £30,264 since then.
That matters more here than in most places. Bournemouth sells more flats than anything else: our area by area breakdown found flats were 42% of all sales in the town over the last year.
The average first-time buyer in BCP paid £248,552, down 2.1% on a year earlier. That is now £571 below the South West first-time buyer average of £249,123.
Where this sits against the peak
The BCP average peaked at £345,134 in December 2022. July’s figure is £35,040 below that, a fall of 10.2%.
It is not the lowest point of this slide, though. That was February 2026, at £308,022. Prices recovered a little in the spring and have fallen back since.
Land Registry expresses the same thing as an index, with January 2023 set at 100. BCP now stands at 90.5. England stands at 102.7.
A correction to last month’s numbers
Land Registry revises recent months as late sales are registered. When we reported June’s figures, the average was £312,162 and the annual fall was 1.6%. The revised June figure is £312,689, £527 higher, and the annual fall now reads 1.4%.
The direction has not changed. But it is a reminder that the latest month in any release is the least settled, and July’s figure may move too.
Two health warnings on these numbers
First, the UK House Price Index is a mean average, not a median. A handful of Sandbanks or Canford Cliffs sales can move it without saying anything about what a flat in Boscombe is worth.
Second, “Bournemouth” here means the whole council area. The index measures Bournemouth, Christchurch and Poole together. For what homes actually sold for in Southbourne, Winton, Boscombe, Charminster, Kinson and the town centre, see our postcode by postcode prices.
What it means for you
- Selling a flat: price against this year’s sales. The average flat is back to where it was in early 2021, well below its 2022 peak.
- Buying: the BCP average is falling while England’s rises, and first-time buyers now pay slightly less here than the South West average.
- Remortgaging: if your valuation was set in 2022, expect it to come in lower. The typical BCP home has lost about a tenth of its value since then.
The index is published monthly, about six weeks in arrears. August’s figures are due in mid October, and we will update our house prices page when they land.
Have your say